
If you follow teer results regularly, sooner or later you will come across the teer result chart 2026. It looks like a big monthly grid full of dates, columns and two digit entries, and at first glance it can feel confusing. New visitors often ask the same questions. What do the columns mean? Why are there two rounds? How do I find a specific date? This guide answers all of that in plain language. By the end, you will know how to read any teer chart with confidence, how monthly records are organised, and how to keep track of past results in a way that is accurate and responsible.
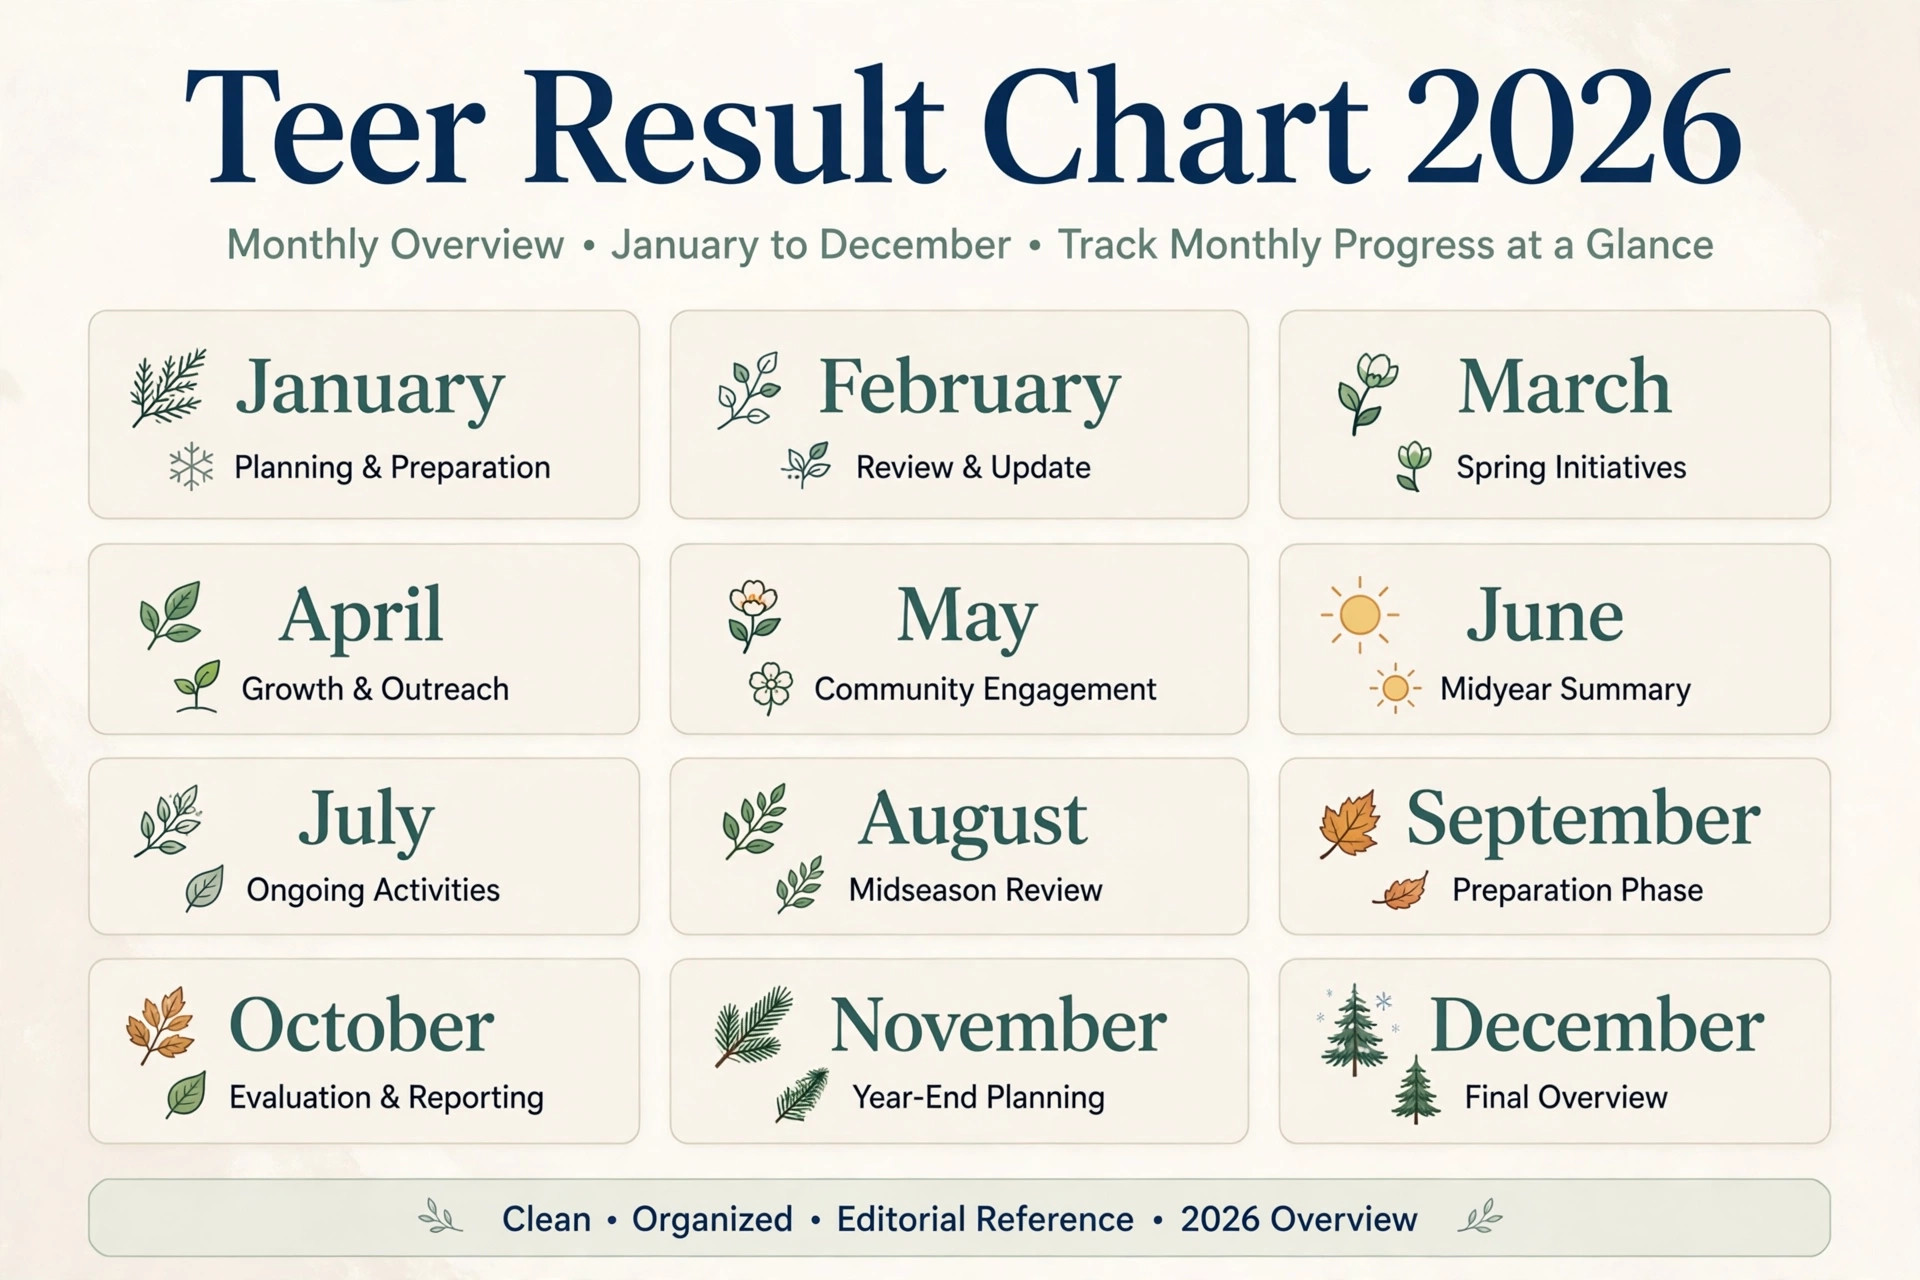
What Is the Teer Result Chart 2026
A teer chart is a structured record of declared teer results arranged by date. The teer result chart 2026 simply refers to the collection of these records for the current year, 2026. Instead of hunting through scattered daily announcements, you can open one monthly chart and see every declared result for that month in a single view. Each row usually represents one calendar day, and each day is split into the rounds that were actually declared.
Teer is an archery based lottery game played in Meghalaya under state rules. Each round of the game produces a winning number, and that number is what appears in the chart. Because several markets run on the same day, such as Shillong, Juwai and Khanapara, a complete chart set may contain separate monthly grids for each market. When people say “teer chart” without naming a market, they usually mean the chart for the market they follow most closely, which is very often Shillong.
The important thing to understand is that a chart is a record, not a prediction tool. It shows what has already been declared. It cannot tell you what will happen tomorrow, and no reading method changes that. We will come back to this point several times, because it is the single most misunderstood thing about teer charts.
Why Charts Are Published
Charts exist for one practical reason. Daily results get announced and then people need to look them up later. Maybe you missed the evening declaration. Maybe you want to check the date you last participated. Maybe you simply want to see the full month at a glance. A chart solves all of these needs without requiring you to scroll through weeks of separate posts. It is the closest thing teer has to an archive, and it makes the game more transparent for everyone who follows it.
What a Chart Is Not
A chart is not a hint sheet, a formula, or a shortcut to future results. There is a whole culture of so called chart reading methods that claim to extract patterns from old results and turn them into winning numbers. The brief you are reading right now contains no such content, and that is deliberate. We do not publish common numbers, hit numbers, target numbers, house or ending numbers, and we do not offer betting advice of any kind. If another website tells you its chart analysis can predict tomorrow, treat that claim with healthy scepticism. The game is random by design, and records of past rounds do not influence future rounds.
How a Monthly Teer Result Record Is Organised
Let us walk through the anatomy of a typical monthly teer result record so you can read one at a glance. While the exact layout varies from site to site, most charts follow the same underlying logic, which is good news. Once you learn the pattern, you can read any chart from any publisher.
Rows Represent Dates
The backbone of the chart is the date. Each row, or each cell in a grid, corresponds to one calendar day of the month, from the 1st to the last day. Days on which no game was held, such as Sundays when teer is typically not played, are usually left blank or marked with a dash. That blank space is information too. It tells you there was no declaration that day, so you should not waste time searching for a result that does not exist.
Columns Represent Rounds
Each date is divided into the rounds that were declared that day. For the main afternoon markets, you will usually see two columns labelled FR and SR, standing for First Round and Second Round. Morning markets also have their own FR and SR columns on their own charts. A few special or night sessions may appear on separate charts with their own round labels. The key skill is to match the column to the round you care about. If you only participated in the second round, only the SR column matters to you. Glancing at the wrong column is one of the most common beginner mistakes.
Entries Are Two Digit Results
Each declared result appears as a two digit number in the appropriate cell. To protect against confusion, a careful reader treats every number in the chart as a historical record and nothing more. In this guide, whenever we illustrate the format, we will show it as XX, which is an example only and not a real result. Real charts show the actual declared numbers, which we reproduce only from genuine declarations on our result pages, never invented.
Market Separation
A single chart covers one market. The Shillong teer chart covers Shillong. The Juwai chart covers Juwai. Mixing them up is another classic error, because the markets run at different times and their numbers have nothing to do with each other. Always check the heading of the chart before reading a single cell. On this website, each market has its own result page, so you can move from the chart back to the daily page for the same market without confusion. Our teer result list gathers the archives for every market in one place, which is handy when you want to compare chart dates with the original daily announcements.
Reading the FR and SR Columns in a Teer Number Chart
FR and SR are the two pillars of almost every teer number chart, so let us make sure you understand exactly what they mean and how they are declared.
What FR Means
FR stands for First Round. In the afternoon Shillong game, the first round is typically declared in the afternoon, and in morning markets it is declared earlier in the day. Archers shoot a set number of arrows at the target, and the number of arrows that hit the target determines the result. Only the last two digits of that count become the official winning number. When the chart shows an entry under the FR column for a date, that is the officially declared first round result for that market on that date.
What SR Means
SR stands for Second Round. It is a separate round with its own set of archers and its own declaration time, later than the first round. The second round result is independent of the first round result. One does not determine or limit the other. In the chart, the SR column sits beside the FR column for the same date, so you can see both rounds of a day side by side.
Why Some Cells Are Empty
You will sometimes find a date with an FR entry but no SR entry, or a date with nothing at all. There are legitimate reasons for this. Declarations can be delayed on a given day. A session can be cancelled because of weather or local conditions. Sundays are normally off days. A blank cell does not mean the chart is broken, and it does not mean you should fill in the gap with a guess from somewhere else. If a cell is empty, the correct response is to wait for the official declaration or accept that the round did not happen.
Reading Order and Timing
Read a chart the way time flows, from the top of the month downward. Each day’s results become final only after the official declaration for that round. Numbers that appear online before the official declaration time are unofficial and should be ignored. One of the biggest sources of confusion is premature or fake results circulating on social media. The chart only gains an entry after the real declaration, which is why the chart is more trustworthy than a forwarded message.
Teer Result Chart 2026 – Declaration Timings and Daily Records
The teer result chart 2026 becomes useful in daily life when you connect it to the actual declaration schedule. Charts do not live in a vacuum. They are the written trace of a daily rhythm, and knowing that rhythm helps you read the chart correctly and know when to expect new entries.
The Daily Rhythm Behind the Chart
Teer follows a fixed daily pattern on playing days. Morning markets declare their rounds in the late morning and early afternoon. The main afternoon markets declare the first round in the afternoon and the second round later in the afternoon or evening. Night sessions, where they exist, declare in the evening. These times are approximate and can shift on special days, but the order is constant. Morning first round comes before morning second round, afternoon first round comes before afternoon second round. The chart reflects this order in its columns, which is why learning the order once pays off every day.
When New Entries Appear
A chart entry appears only after the corresponding round has been officially declared. This means the chart for today fills in gradually through the day. The morning columns fill first, then the afternoon FR column, then the afternoon SR column. If you open the monthly chart in the middle of the day and see only some columns filled, that is normal. The rest will appear as declarations happen. Patience is part of reading charts correctly.
How the 2026 Records Build Up
Across 2026, each month adds one more completed grid to the archive. January fills in day by day, then February starts fresh. This monthly reset is why the phrase monthly teer result is so useful as a search. People usually want one month, not the whole year. When you look something up, always confirm which month you are viewing. An easy mistake is reading January’s row for the 15th when you meant March’s. The month heading is usually at the top of the chart, so check it before you read any number.
Declaration Timing vs Chart Time
One subtle point deserves attention. The chart records the date of the game, not the time you viewed it. If a night round is declared late in the evening, it still belongs to that calendar date’s row. Time zones can also create confusion for readers outside the region, but the chart always follows local game dates. As long as you read the date label on the row, you are on safe ground.
How to Read a Shillong Teer Chart Step by Step
Now let us put everything together into a practical routine. This is the exact sequence to follow whenever you open a shillong teer chart or any other market chart.
Step 1 – Confirm the market. Look at the chart heading and make sure it names the market you want, for example Shillong, Juwai or Khanapara. Our Shillong teer result page is the home for Shillong declarations, and its chart covers Shillong only.
Step 2 – Confirm the month and year. Check that the chart is for the month you are interested in and that it belongs to 2026. Old charts from previous years look identical in structure, so this check prevents a very common error.
Step 3 – Find your date. Scan the rows to the date you care about. Remember that off days and cancelled sessions appear as blanks, which is normal.
Step 4 – Pick the right column. Choose FR or SR depending on the round you participated in or want to verify. Do not read across to the neighbouring column by accident.
Step 5 – Cross check with the daily page. For important verifications, compare the chart entry with the daily result announcement for that date on this site. The daily page is the primary record, and the chart is the convenient summary. When both agree, you can be confident.
Step 6 – Note the timing. If the declaration for that round has not happened yet today, the cell should be empty. An entry that appears before the official time is a red flag, and you should wait for the genuine declaration.
This six step routine takes less than a minute once it becomes a habit, and it protects you from nearly every chart reading mistake.

Using Monthly Records Without Falling for Chart Myths
Charts are factual, but the stories people build around them are often not. Because a teer chart shows a long series of past results, it invites the human habit of pattern hunting. We see streaks, repeats and gaps, and our brains want them to mean something. Understanding why they do not is the most valuable chart skill of all.
Past Results Do Not Influence Future Rounds
Each teer round is an independent event. The number of arrows hitting the target in one round has no physical connection to the next round. A number that appeared three times this month is not “due” to disappear, and a number that has not appeared is not “due” to show up. This is the same principle behind coin tosses. Ten heads in a row do not make tails more likely on the next toss. Charts display history, and history in a random game carries no predictive weight.
The Problem With Pattern Systems
Many so called chart reading systems claim that certain arrangements of past numbers point to future ones. Some count frequencies, some track gaps between repeats, some combine FR and SR columns in elaborate ways. None of these methods can work, because there is no mechanism linking past declarations to future ones. At best they are entertainment, at worst they cost people money by creating false confidence. We publish charts as records, and we deliberately publish no prediction content, no common numbers, no hit numbers, no target numbers and no house or ending numbers. That is a policy, not an oversight.
What Charts Are Genuinely Useful For
This does not mean charts are useless. Far from it. Charts are excellent for verification. If you need to confirm what was declared on a past date, the chart gives you the answer in seconds. They are excellent for completeness checks, showing at a glance which days had declarations and which did not. They are useful for understanding the schedule, because a month of filled and blank cells teaches you the playing pattern faster than any description. And they are useful for record keeping, which we will cover next. All of these uses treat the chart as what it is, a historical record.
How to Keep Your Own Monthly Teer Result Record
Some readers prefer to maintain a personal teer result record, and doing it well is straightforward. A personal record is especially handy if you participate regularly and want your own log independent of any website.
Choose a Simple Format
A notebook, a spreadsheet, or a notes app all work. Create columns for date, market, FR and SR. Keep one sheet or section per month so the structure matches the published charts. Simplicity matters more than sophistication. A clean personal record you actually maintain beats a complex one you abandon in February.
Copy Only Declared Results
Enter a result into your record only after the official declaration. Never fill in a number from an unofficial forward, a social media post, or a guess. If you are unsure, leave the cell blank and check the official daily page later. A personal record is only as trustworthy as the discipline behind it, and one invented entry ruins the whole point.
Review Monthly, Not Daily
The temptation with a personal record is to stare at it looking for patterns. A healthier routine is to use it for verification and completeness. At the end of each month, glance through it to confirm every playing day has its entries and every off day is blank. That is the legitimate use of a personal teer chart, and it keeps the exercise honest.
Back Up What Matters
If your record lives on a phone, make sure it is backed up. Losing months of careful logging to a broken device is frustrating and avoidable. A spreadsheet in cloud storage is the simplest durable option for most people.
Common Mistakes When Reading Teer Charts
Even experienced readers slip up. Here are the mistakes we see most often, with the fix for each.
Mixing Up Markets
Reading the Juwai column while thinking about Shillong is the classic error. The fix is the market check in Step 1 of the routine above. Always read the heading first. If you follow more than one market, keep their charts on separate pages or tabs. Our Juwai teer result page keeps Juwai records separate from Shillong, which removes this risk entirely.
Reading the Wrong Month
Charts from different months look alike. The fix is to check the month heading every time, especially when you arrive at a chart from a search result or a shared link that may point to an older month.
Trusting Unofficial Numbers
Forwarded messages and social media posts sometimes carry numbers before or instead of the official declaration. The fix is to treat the daily result page on a trusted site as the source of truth and the chart as its summary. If a number appears in a message but not in the chart after declaration time, the message was wrong.
Confusing FR and SR
The two columns sit side by side, and tired eyes swap them. The fix is to say the round out loud or point at the column header before reading the cell. It sounds silly, and it works.
Assuming Blanks Are Errors
A blank cell on an off day or a cancelled session is correct, not a mistake. The fix is to learn the playing pattern, which is usually no game on Sundays, so blanks on those dates are expected.

Responsible Play and Legal Context
Teer is a legal lottery game in the state of Meghalaya, conducted under state government rules. Participation is for adults aged 18 and above only. If you choose to participate, do so responsibly and within your means, and never treat charts, records or any analysis as a way to guarantee outcomes, because no such way exists. For background on how the game is understood publicly, the Teer article on Wikipedia gives a useful overview, and the Government of Meghalaya portal is the official source for state information. Our homepage carries the daily results for every market we cover, updated as declarations happen.
Frequently Asked Questions
What is the teer result chart 2026?
The teer result chart 2026 is the organised record of declared teer results for the year 2026, usually presented as one monthly grid per market. Each row is a date, each date is split into FR and SR columns, and each cell holds the officially declared result for that round. It is a historical record for lookup and verification.
How often is the teer chart updated?
The chart fills in through each playing day as rounds are declared. Morning columns appear first, then afternoon FR, then afternoon SR. A cell appears only after the official declaration for that round, so a partially filled chart during the day is normal.
What do FR and SR mean in a teer chart?
FR stands for First Round and SR stands for Second Round. They are two separate rounds of the same market on the same day, each with its own archers, its own declaration time and its own result. Always read the column that matches the round you care about.
Can the teer chart help me predict future results?
No. Each round is independent, and past results do not influence future ones. Charts are records for verification and reference, not prediction tools. We do not publish common numbers, hit numbers, target numbers, or house and ending numbers, and you should treat any site that claims its chart analysis can predict results with scepticism.
Where can I find old teer result records?
Monthly charts on this site archive past declarations by market and month. The teer result list page gathers the archives in one place, and each market page, such as the Shillong teer result page, keeps its own history. Always confirm the month heading so you read the right month.
What should I do if a chart cell is blank?
First check whether the date was an off day, such as a Sunday, or whether the declaration simply has not happened yet. Blanks on non playing days are normal. If the round was declared and the cell is still empty much later, check the daily result page for that date to confirm the official result.
Is it legal to keep teer result records?
Keeping a personal record of publicly declared results is fine. Teer itself is a legal lottery in Meghalaya for adults aged 18 and above. Records and charts do not change the legal status of participation, and responsible play within your means is always the right approach.
Conclusion
The teer result chart 2026 is at its best when you treat it as what it is, a clear monthly record of declared results. Learn the layout, match the market and the month, pick the right FR or SR column, and cross check with the daily page when it matters. Keep your expectations honest. No chart can predict the next round, and no pattern in old numbers changes that. Used correctly, the chart saves you time, settles doubts about past dates, and keeps your own records accurate. That is more than enough reason to learn to read it well.